UPDATE: The report on job polarization in Oregon has been released, click the link for more information including a set of slides.
Lately there has been an amazing amount of pixels spent on describing the quality and pay of the job growth. Most recently both the Wall Street Journal and the Federal Reserve Bank of Atlanta compare industry sectors by average pay and lament the fact that most of the jobs are in lower-paid industries. I want to push back on these conclusions a little bit and also expand upon them. In short, yes, the U.S. economy is adding a large number of low-paying jobs, however we are also seeing relatively strong growth at the top end of the employment scale as well. We are missing the growth in jobs at the middle of the income distribution. If this all sounds familiar, it is. This is the continuation of the job polarization process analyzed, described and researched extensively by MIT’s David Autor. I am borrowing from his work (along with Acemoglu), the great work the Federal Reserve Bank of New York has done and also Jaimovich and Siu. I have a forthcoming research paper on job polarization in Oregon and will presenting on the subject at Tim Duy’s Oregon Economic Forum in October. What follows is a very brief overview of some of these trends at the national level.
First, while I do not completely disagree with the articles being written recently, I do want to point out that the fundamental changes occurring in the labor market are best seen at the occupational level not the industry level. When discussing cognitive or routine or manual type functions and how technological change is impacting them, these generally cut across industries by occupation. When I look at employment growth from 2010 to 2012, using occupational groups, I get the following (trying to match the great graphics that both the WSJ and Atlanta Fed use).
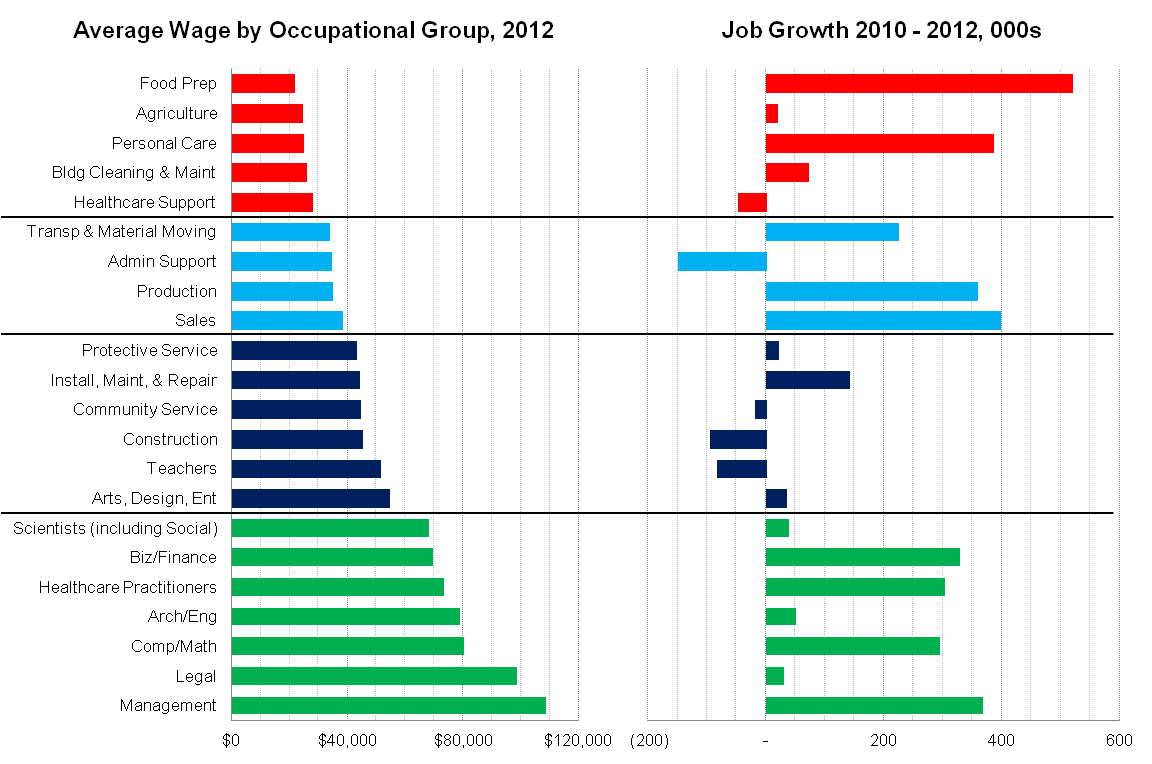
What we see here is strong job growth at both the top and bottom ends of the wage spectrum. Yes, food preparation and personal care account for a disproportionately large share of jobs gained in recent years, but so too have business and financial services, healthcare practitioners, computer and mathematical occupations and management. Where we have seen slower growth is in the middle. The light blue bars, which I term lower middle-wage jobs account for about 40% of all occupations in 2012 yet account for just 26% of the growth. The dark blue bars, which I term upper middle-wage jobs, account for another 19% of all occupations and 0% of the growth. This, by definition, is job polarization. These patterns have been ongoing in the U.S. and in Oregon for decades and as Jaimovich and Siu point out, the process is exacerbated during recessions. These middle-wage occupations fell much further during the Great Recession and are growing much slower coming out, if at all. Expectations are for these occupations to continue to grow in absolute numbers as the expansion continues, however the relative growth rates will likely continue to lag.
This has been just an excerpt, but is important to add to the ongoing national discussion. Look for my Oregon specific research report in the next month or so. Finally, while the above looks at broader occupational groups, one can dive into individual occupations. Although BLS warns against such work as you do lose some coverage given definitional changes and tweaks, it can still be informative. Below I take all individual occupational data from 2010 and 2012 and break employment down into approximate deciles and show the changes. Here, in particular, one can see the lack of job growth in the middle-wage range.


[…] More on Job Growth Quality – Oregon Office of Economic Analysis […]
By: Links for 08-13-2013 | Symposium Magazine on August 13, 2013
at 12:03 AM
[…] at 5:32 on August 20, 2013 by Mark Thoma Via Josh Lehner at Oregon Economic Analysis: … I do want to point out that the fundamental changes occurring in the labor market are best […]
By: ‘This, by Definition, is Job Polarization’ | The Penn Ave Post on August 20, 2013
at 2:32 AM
[…] Via Josh Lehner at Oregon Economic Analysis: […]
By: 'This, by Definition, is Job Polarization' | Symposium Magazine on August 20, 2013
at 2:36 AM
Excellent post, Mr. Lehner. What I take away from the data is that the best chance to have a good job is to graduate in the top 10 percent of a top-flight university. Anything less, and you’re much more likely to be delivering dinner to the high-acheivers or boxing up their Amazon purchases. I wonder how long our society will last under that arrangement.
By: Tom on August 20, 2013
at 6:44 AM
[…] way of Mark Thoma, here is Josh Lehner from the Oregon Office of Economic Analysis (emphasis in bold […]
By: The Hourglass Economy | The McLean Parlor on August 20, 2013
at 9:33 AM
[…] way of Mark Thoma, here is Josh Lehner from the Oregon Office of Economic Analysis (emphasis in bold […]
By: The Hourglass Economy | Punditocracy on August 20, 2013
at 10:31 AM
[…] Staggering New Numbers | Peter Gleick: Peak Water in the American West | Josh Lehner: More on Job Growth Quality […]
By: Noted for August 20, 2013 on August 20, 2013
at 8:01 PM
[…] Where the jobs are (Oregon Office of Economic Analysis) […]
By: Wednesday reads & daily charts … « Fusion Blog on August 20, 2013
at 11:01 PM
[…] –Job Polarization: Josh Lehner looks at what occupations are seeing job growth. “What we see here is strong job growth at both the top and bottom ends of the wage spectrum. Yes, food preparation and personal care account for a disproportionately large share of jobs gained in recent years, but so too have business and financial services, healthcare practitioners, computer and mathematical occupations and management. Where we have seen slower growth is in the middle. The light blue bars, which I term lower middle-wage jobs account for about 40% of all occupations in 2012 yet account for just 26% of the growth. The dark blue bars, which I term upper middle-wage jobs, account for another 19% of all occupations and 0% of the growth. This, by definition, is job polarization. These patterns have been ongoing in the U.S. and in Oregon for decades and as Jaimovich and Siu point out, the process is exacerbated during recessions. These middle-wage occupations fell much further during the Great Recession and are growing much slower coming out, if at all. Expectations are for these occupations to continue to grow in absolute numbers as the expansion continues, however the relative growth rates will likely continue to lag.” […]
By: Secondary Sources: Job Polarization, Fed Guidance, Safe Banks - Real Time Economics - WSJ on August 21, 2013
at 4:55 AM
[…] at 10:23 on August 21, 2013 by Mark Thoma Via Josh Lehner at Oregon Economic Analysis: … I do want to point out that the fundamental changes occurring in the labor market are best […]
By: ‘This, by Definition, is Job Polarization’ | The Penn Ave Post on August 21, 2013
at 7:23 PM
[…] of Economic Analysis, looking at specific occupations rather than broad industries. Here the trend is even more pronounced (click to […]
By: Here’s where middle-class jobs are vanishing the fastest on August 27, 2013
at 8:17 AM
[…] of Economic Analysis, looking at specific occupations rather than broad industries. Here the trend is even more pronounced (click to […]
By: Here's where middle-class jobs are vanishing the fastest | RocketNews on August 27, 2013
at 10:23 AM
[…] at occupations, rather than overall industries, also shows the same trend. The next chart, below, shows that decline or relatively slow growth of jobs in the dark blue section– the […]
By: Where the jobs are disappearing | The Support Center on August 27, 2013
at 12:31 PM
[…] have changed the nature of work and the kind of skills American employers demand. Economist Josh Lerner believes that in order to understand structural shifts you need to look at employment by […]
By: Five years after recession, we still can’t agree on what causes joblessness | The Great Debate on August 28, 2013
at 7:19 AM
[…] but not at a fast enough rate to produce significant progress, said Josh Lehner, senior economist. Low- and high-wage jobs tend to be returning, not middle-wage jobs such as teaching and construction…. That could mean former workers are taking lower-paying jobs — and workers in those jobs may […]
By: State officials struggle to reduce need for welfare, food stamps | Oregon News on September 8, 2013
at 10:52 AM
[…] but not at a fast enough rate to produce significant progress, said Josh Lehner, senior economist. Low- and high-wage jobs tend to be returning, not middle-wage jobs such as teaching and construction…. That could mean former workers are taking lower-paying jobs — and workers in those jobs may […]
By: State officials struggle to reduce need for welfare, food stamps | Idaho News on September 8, 2013
at 12:14 PM
[…] but not at a fast enough rate to produce significant progress, said Josh Lehner, senior economist. Low- and high-wage jobs tend to be returning, not middle-wage jobs such as teaching and construction…. That could mean former workers are taking lower-paying jobs — and workers in those jobs may […]
By: State officials struggle to reduce need for welfare, food stamps | Business News on September 9, 2013
at 12:48 AM
[…] is provide training opportunities for skills and occupations that are in demand from businesses (think job polarization as well), thus better matching the unemployed with job openings. Many of the safety net programs are […]
By: What Happens to the Unemployed? | Oregon Office of Economic Analysis on September 25, 2013
at 10:23 AM
[…] To further highlight the trend on a more granular level with income bands and job category growth levels, echoes the same phenomenon but at a state level, in this case in Oregon. […]
By: HOW DIGITAL INNOVATION WILL DRIVE WEALTH AND KILL REAL JOB GROWTH: PART 2 | on February 25, 2014
at 12:42 PM
[…] trends with growth disproportionately concentrated among the high- and low-wage occupations. As I wrote previously, “this, by definition, is job […]
By: Update on Job Polarization | Oregon Office of Economic Analysis on March 25, 2015
at 1:01 PM